HOTELS RESIST WIDER INVESTMENT TRENDS
Savills recent UK Commercial ‘Market in Minutes’ report has revealed that in 2018, all sector investment volumes totalled £62.4bn, a decrease of 4.8% on the previous year. The trend has continued this year, with volumes to the end of April down 15.7% on the same period last year. Interestingly, UK hotels have avoided this wider trend, with total hotel transaction volumes reaching £7.8bn last year, up 45% on 2017 data. The sector has been boosted by the acquisition of a number of large portfolios.
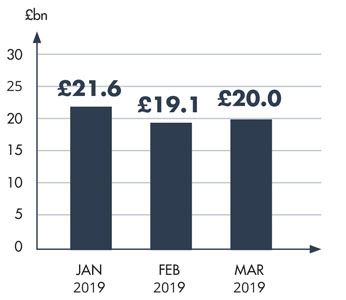
So far, the UK hotel sector has experienced more modest growth in Q1 2019; a 2.7% year-on-year increase on Q1 2018, boosted by the acquisition of the Grange portfolio by Queensgate Investments for £1bn. Queensgate acquired the Grange’s upmarket hotels at St Paul’s, Holborn, Tower Bridge and the City. In total the portfolio comprises 1,345 rooms and 930,000 sq. ft of real estate.
This appetite for hotels has led Savills to expect some potential downward shifts in yields going forward.
16-YEAR LOW FOR UK SHOPPING CENTRE DEVELOPMENT
During the first quarter of 2019, shopping centres worth only £20m changed hands. According to statistics from commercial property data specialists Costar, this compares with a 10-year quarterly average of £783m. Mark Stansfield, Head of UK Analytics at CoStar commented that this was the weakest quarter in 16 years and “probably this century“.
The downturn in the sector has been prompted by retailers grappling with higher costs and consumers transitioning to online purchases.
Mark Garmon-Jones, director of UK retail investment at the property agency Savills, said the slow market was because of: “occupational uncertainty, and political and economic uncertainty around Brexit“.
EDINBURGH NEXT ON THE FLEXIBLE WORKSPACE AGENDA
Edinburgh is the next destination that flexible office provider WeWork has selected as its third city in the UK to establish. Backed by billions of pounds of investor cash, the New York based start-up is opening 46,000 sq. ft on George Street, which will accommodate around 800 tenants. The premises, in the city’s New Town district, will be ready towards the end of 2019.
Wework’s UK and Ireland General Manager, Mathieu Proust, commented that opening space in Edinburgh was the “logical next step” after London, where it has 50 buildings planned and open, and Manchester, where it has four sites.
INDUSTRIAL PROPERTY SECTOR CONTINUES TO LOOK STRONG
The recently released RICS commercial market survey of Q1 2019 concludes that conditions in the sector remain varied, with industrial property experiencing solid growth and retail displaying little sign of improvement.
In Q1 2019, UK commercial property demand from occupiers saw an overall decline, which stemmed from the retail sector, where 57% of respondents reported a fall in demand. Investment demand for industrial units remains positive, with prime assets predicted to post the strongest capital value gains on a sectoral comparison over the coming year. |